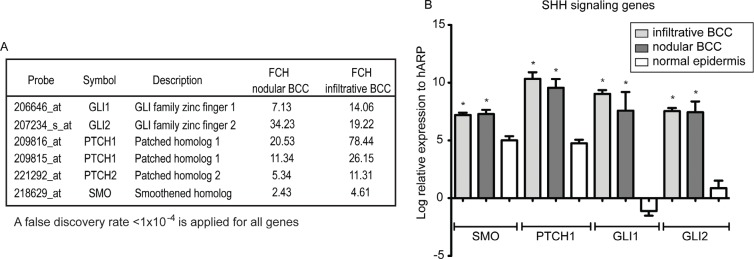
Figure 6. The SHH-signaling genes were up-regulated in BCC tissue.
(A) The fold changes (FCH) for the SHH-pathways genes detected in our gene lists are shown. All genes satisfy false discovery rate <10−4. (B) mRNA expression of the selected SHH-pathway genes (SMO, PTCH1, GLI1, and GLI2) was examined in microdissected BCC tumour nests (Infiltrative and Nodular, n=5 for each group) and normal epidermis (Normal, n=5). Error bars represent S.E.M. and * indicates p<0.05 vs. Normal (one-way ANOVA).

