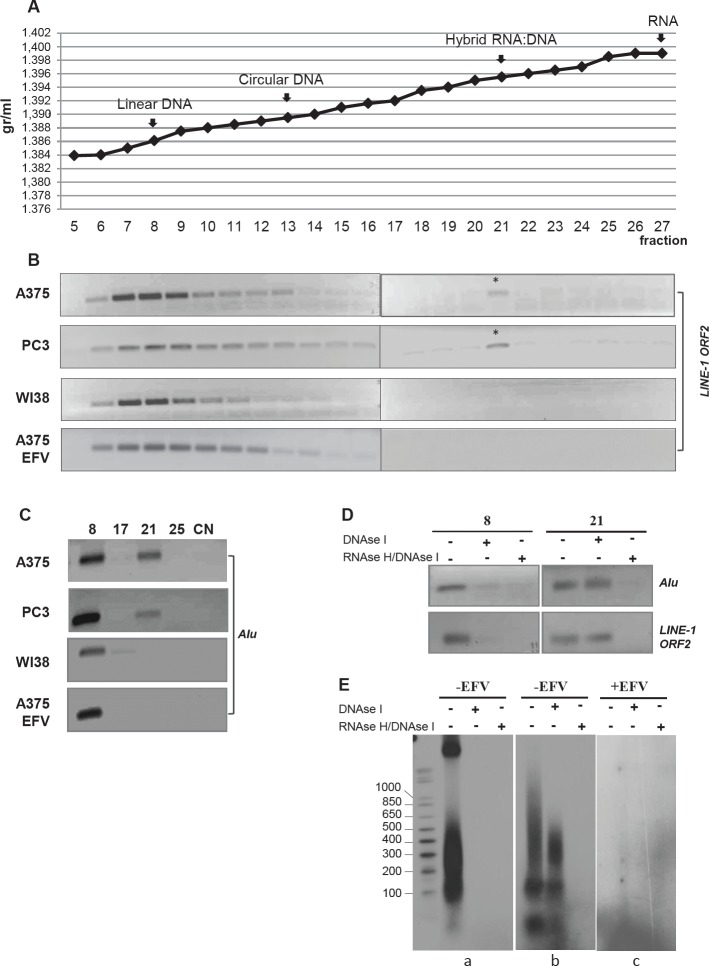
Figure 2. Identification of RNA:DNA hybrid structures through EtBr/CsCl density gradient centrifugation.
A) Buoyant densitiy of linear DNA, circular DNA, RNA:DNA hybrid and RNA used as density markers. Density values are indicated on the y axis and gradient fractions on the x axis. B) PCR amplification of LINE-1 sequences throughout the gradient fractions from untreated A-375, PC3 and WI38 cell lines and EFV-treated A-375 cultures. The asterisk marks LINE-1-specific amplification products in fraction 21. C) PCR amplification of Alu sequences throughout the gradient fractions as in B; only relevant fractions are shown. Numbers indicate the gradient fractions. NC, negative control. D) Alu and LINE-1 PCR amplification of aliquots withdrawn from fractions 8 and 21 of the A-375 DNA-containing gradient, treated with either DNase I alone or sequentially with DNase I + RNase H. E) Samples were labeled by random priming and analyzed through a 1.5% agarose gel. Panel (a) shows fraction 8 and (b) fraction 21 from untreated A-375 cell samples; panel c shows gradient fraction 21 from EFV-treated A-375 sample.

