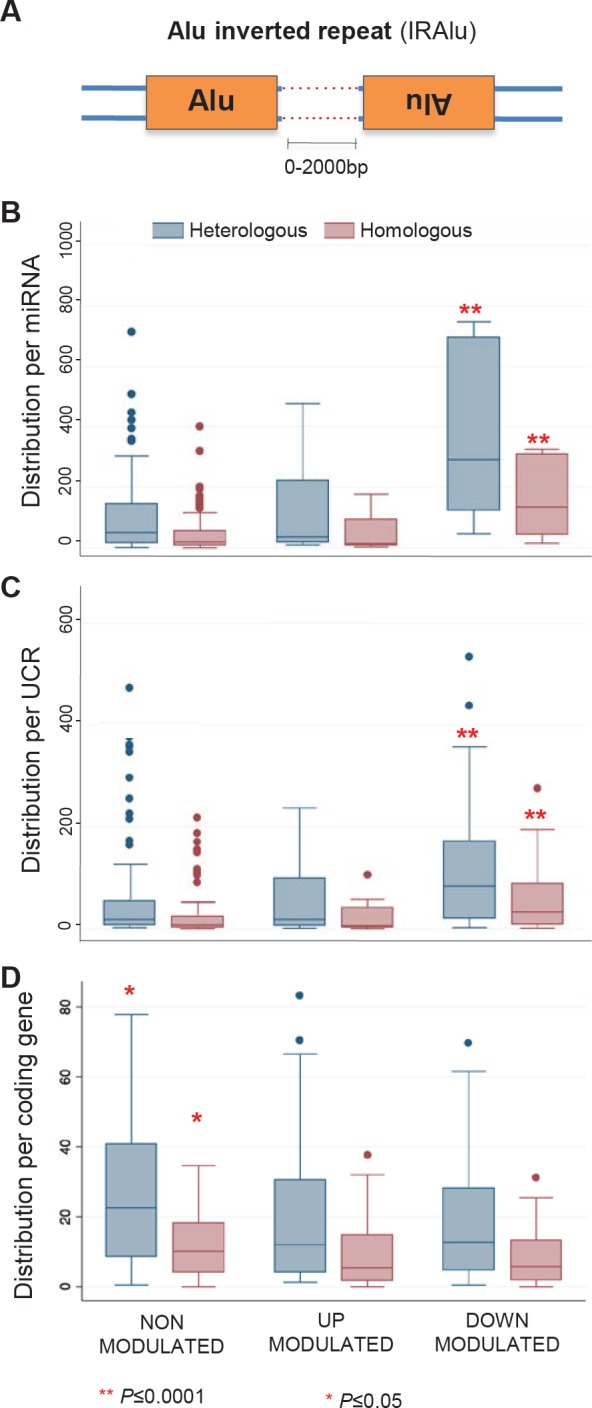
Figure 5. Inverted Alu repeats (IRAlus) distribution around miRNAs, UCRs and coding genes.

IRAlus in which inverted repeats are spaced by less than 2.000 bp are considered (A). The box and whisker plots represent the distribution of numbers of IRAlus flanking (+/− 100 Kbp) the indicated sequence classes. IRAlus are highly significantly more abundant (**, P≤0.0001) among EFV-downregulated miRNAs (B) and UCRs (C), but not among EFV-modulated coding genes (D). Blue box plots represent heterologous IRAlus (i.e., Alu inverted repeats from two distinct subfamilies), red box plots represent homologous IRAlus (i.e., both Alu repeats from the same subfamily).
