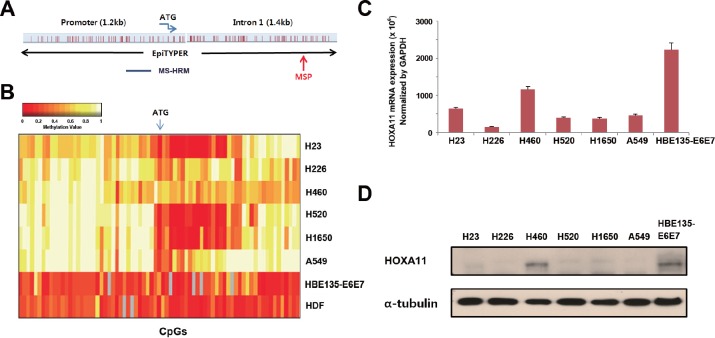
Figure 1. Analysis of the methylation and expression of HOXA11 in vitro.
(A) Gene map shows location of CpGs that were studied by different methods in this study. (B) The methylation status of 90 CpGs at the promoter region of HOXA11 was analyzed using the EpiTYPER™ assay in six lung cancer cell lines (H23, H226, H460, H520, H1650, and A549), a bronchial epithelial cell line (HBE135-E6E7), and in a normal human dermal fibroblast (HDF). Two-way cluster analysis shows the methylation status of HOXA11 in eight cell lines. Levels of methylation are depicted in color change on a continuous scale from red (0% methylated) to light yellow (100% methylated). X-axis and Y-axis indicate CpG sites and cell lines, respectively. (C & D) The mRNA levels of HOXA11 were analyzed by real-time PCR (C), and protein levels were determined using western blotting (D). Error bars indicate one standard deviation.

