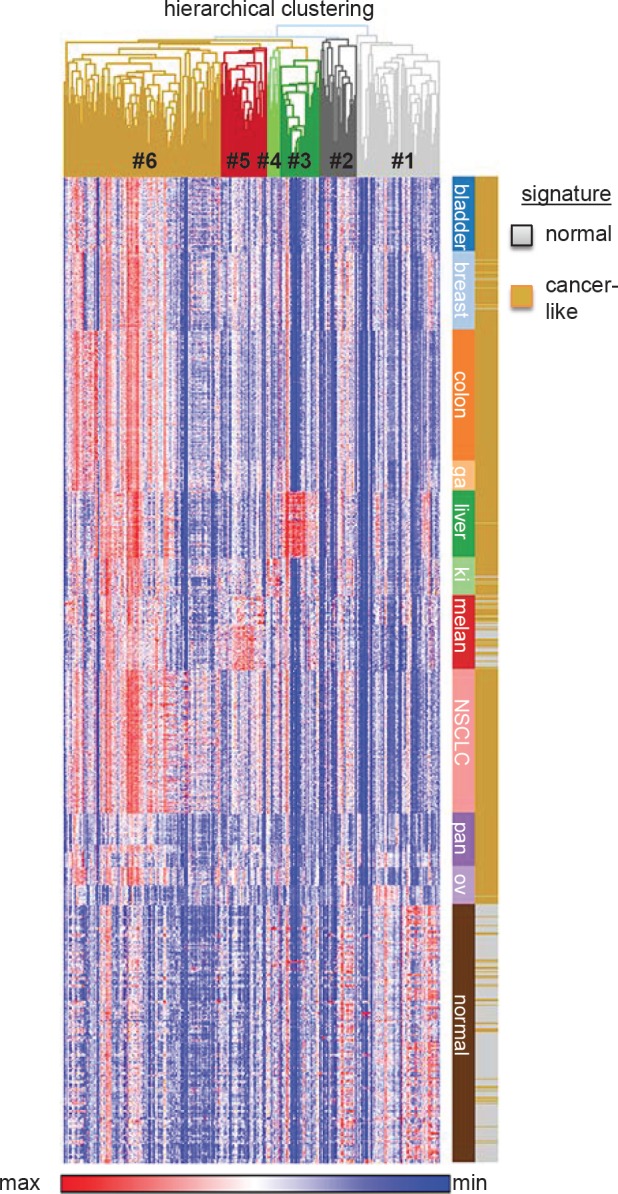
Figure 1. Gene expression patterns of 285 oxidative stress genes in 353 normal tissues and various carcinomas (total n=994, 10 different entities).

Gene expression data were retrieved from the Gene Expression Omnibus (GEO; http://www.ncbi.nlm.nih.gov/gds) of published microarray studies (all Affymetrix HG-U133plus2.0). Normal tissue n=353 (GSE3526) [133]. Carcinomas: bladder n=102 (GSE31684, GSE7476), breast n=107 (GSE36774), colorectal n=177 (GSE17536), gastric cancer (ga) n=43 (GSE22377), liver (hepatocellular carcinoma) n=91 (GSE9843), kidney (ki) n=52 (GSE11151), melanoma (melan) n=101 (GSE10282, GSE15605), lung (non-small-cell lung cancer, NSCLC) n=196 (GSE37745), pancreas (pan) n=52 (GSE17891, GSE32676), ovary (ov) n=73 (GSE14001, GSE18520). All microarray data were normalized simultaneously by RMA [134] using custom brainarray (v15.0) ENTREZG CDF-files as previously described [132, 135, 136]. Hierarchical clustering of genes (1-Pearson correlation) and k-means clustering (2 signatures, 10,000 iterations) of microarray samples were performed with GENE-E software (http://www.broadinstitute.org/cancer/software/GENE-E/index.html). Gene expression data were log2 transformed for depiction in a heat-map.
