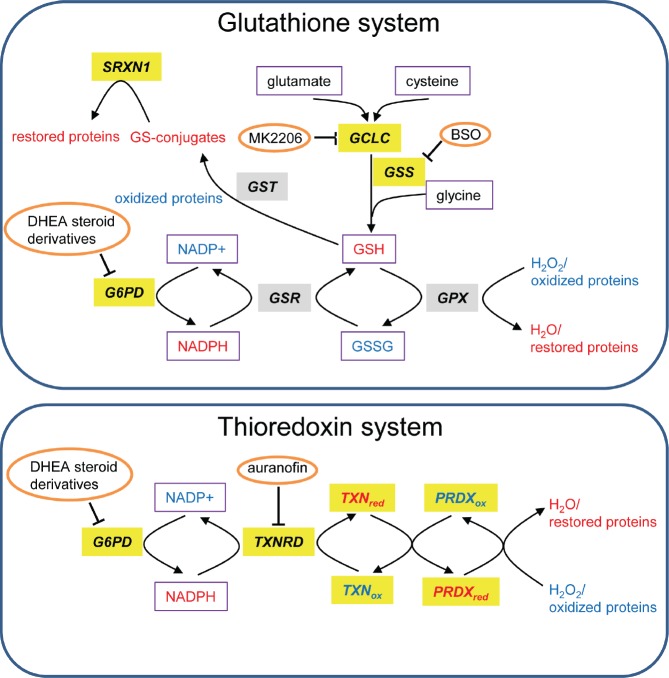
Figure 3. Glutathione and TXN systems.
Genes that are highly expressed in tumors versus normal tissues are highlighted in gray and those associated with bad prognosis in lung or breast cancer are highlighted in yellow. The redox state of proteins and metabolites is depicted in color (red=reduced and blue=oxidized). Metabolites are boxed and inhibitors are circled. This scheme is adapted from [137].

