
Figure 2.
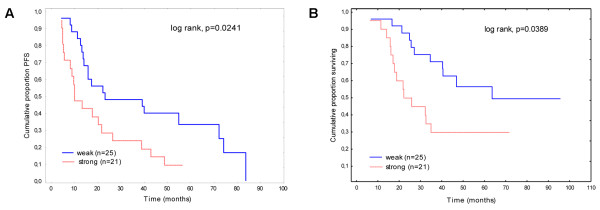
Kaplan-Meier curves for PFS (A) and OS (B) by expression of membranous β-catenin. Red line: strong expression of β-catenin. Blue line: weak expression of β-catenin.
Official websites use .gov
A
.gov website belongs to an official
government organization in the United States.
Secure .gov websites use HTTPS
A lock (
) or https:// means you've safely
connected to the .gov website. Share sensitive
information only on official, secure websites.
Kaplan-Meier curves for PFS (A) and OS (B) by expression of membranous β-catenin. Red line: strong expression of β-catenin. Blue line: weak expression of β-catenin.