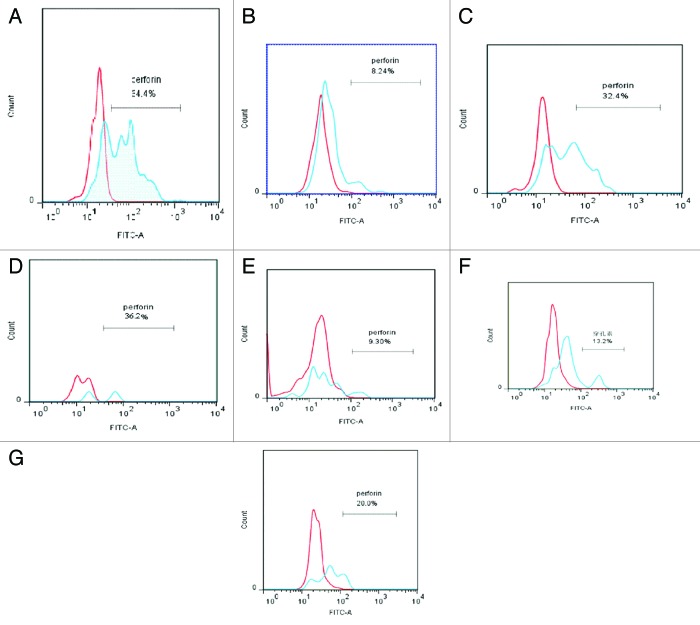
Figure 2. Perforin expression in CD3+CD56+ T lymphocytes in the peripheral blood of patients with AL patient, CR-AL, and healthy controls in relation to WBC count. In each plot, the red peak represents the negative control for perforin, and the blue peak represents perforin expression in each group, respectively.Perforin expression levels in AML and ALL patients were lower than in healthy controls, and remained lower even after CR. Changes in WBC counts in AML and ALL patients had no effect on perforin expression. (A) Healthy controls, (B) AML-1, (C) AML-2; (D) ALL-1, (E) ALL-2, (F) CR-AML, (G) CR-ALL.

An official website of the United States government
Here's how you know
Official websites use .gov
A
.gov website belongs to an official
government organization in the United States.
Secure .gov websites use HTTPS
A lock (
) or https:// means you've safely
connected to the .gov website. Share sensitive
information only on official, secure websites.
