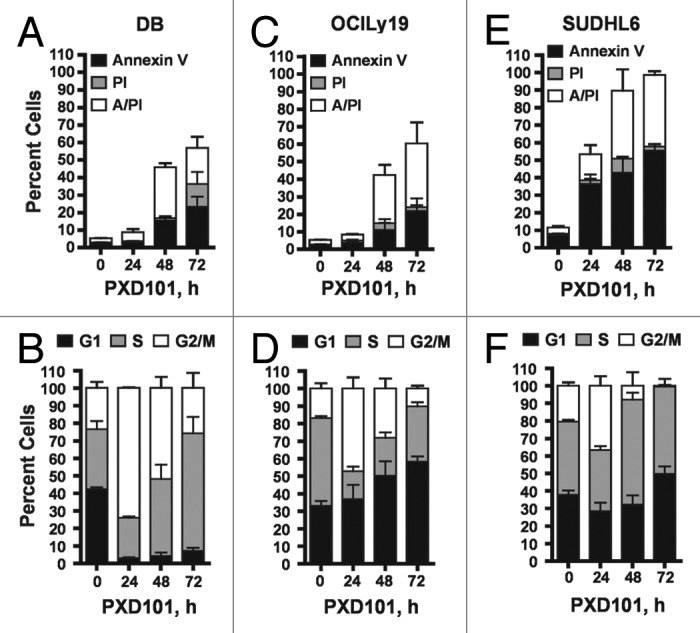
Figure 1. The cytotoxic response to PXD101. DB (A and B), OCI-Ly19 (C and D), and SUDHL6 (E and F) cells were treated with PXD101 at the IC50 concentrations determined for each as shown in Table 1. At 0, 24, 48, and 72 h treatment cells were harvested and subjected to Annexin V/PI assay (A, C, and E) or cell cycle analysis (B, D, and F). The graphs shown represent the results of 3–4 independent experiments. Error bars represent SEM.
