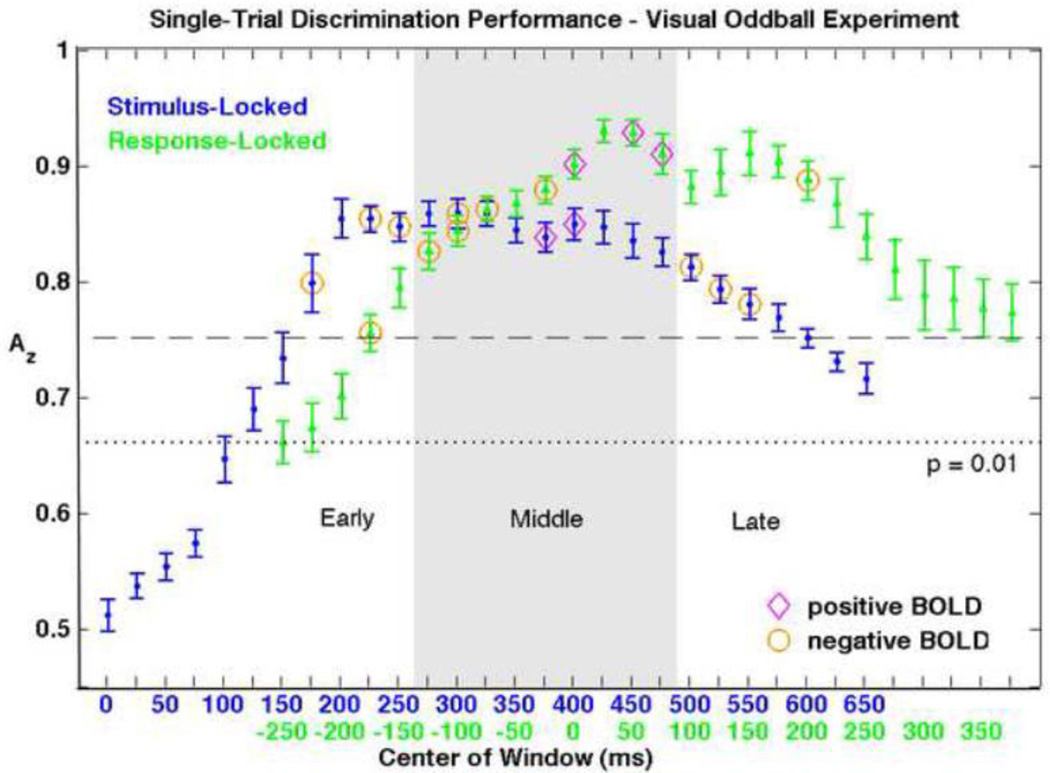
Figure 3. Group mean averages and standard errors of single-trial EEG discrimination performance.
Results of both the stimulus-locked (blue) and response-locked (green) analyses are shown, aligned by mean RT. Since we are interested in the BOLD correlates of single-trial EEG variability, we only consider EEG components with discrimination that is both significant (Az > 0.66, p < 0.01) and substantial (Az > 0.75). Windows resulting in significant positive and negative BOLD correlations are indicated with magenta diamonds and orange circles, respectively. Early, middle, and late windows (as grouped for discussion) are indicated with shading.

