
Figure 1.
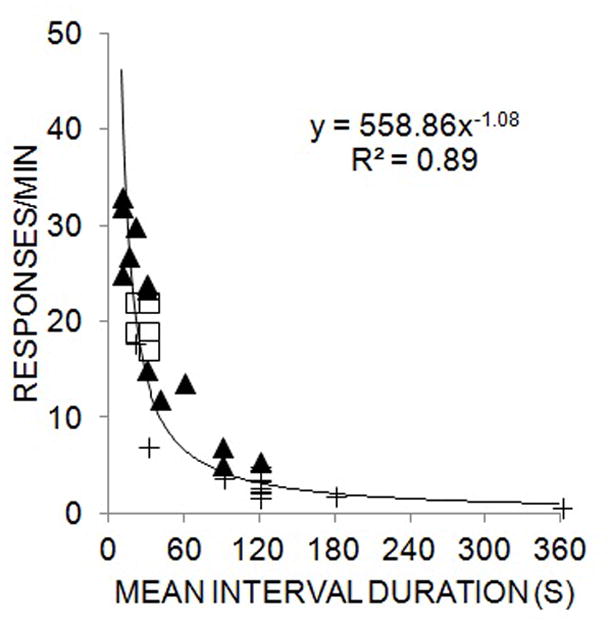
Mean response rate (in responses/min) of head entry responses as a function of mean interval duration. Filled triangles depict data from delay conditioning studies with a noise CS and open squares are data from light CSs. Plus signs are response rates during the inter-trial interval. A single power function is fit through the data, and the equation and goodness of fit (R2) are provided. The data are combined and adapted from Jennings, Bonardi and Kirkpatrick (2007) and Kirkpatrick (2002).