
Figure 2.
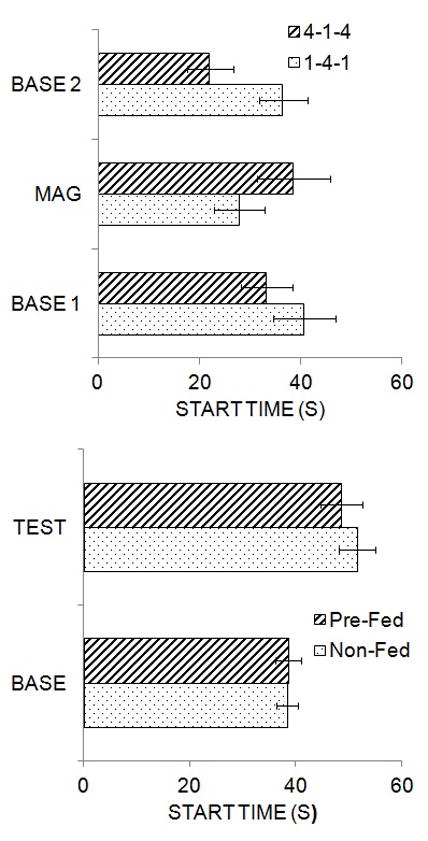
Top: Mean (± SEM) start times during original baseline (BASE 1), magnitude shift (MAG) and return to baseline (BASE 2) phases of training in Groups 4-1-4 and 1-4-1. The data are adapted from Galtress and Kirkpatrick (2009). Bottom: Mean (+ SEM) start times during baseline (BASE) and test (TEST) phases in groups that were pre-fed in original baseline and tested under deprivation (Pre-Fed) or were trained in the baseline phase under deprivation and tested under satiety (Non-Fed). The data are adapted from Galtress, Marshall, and Kirkpatrick (2012).