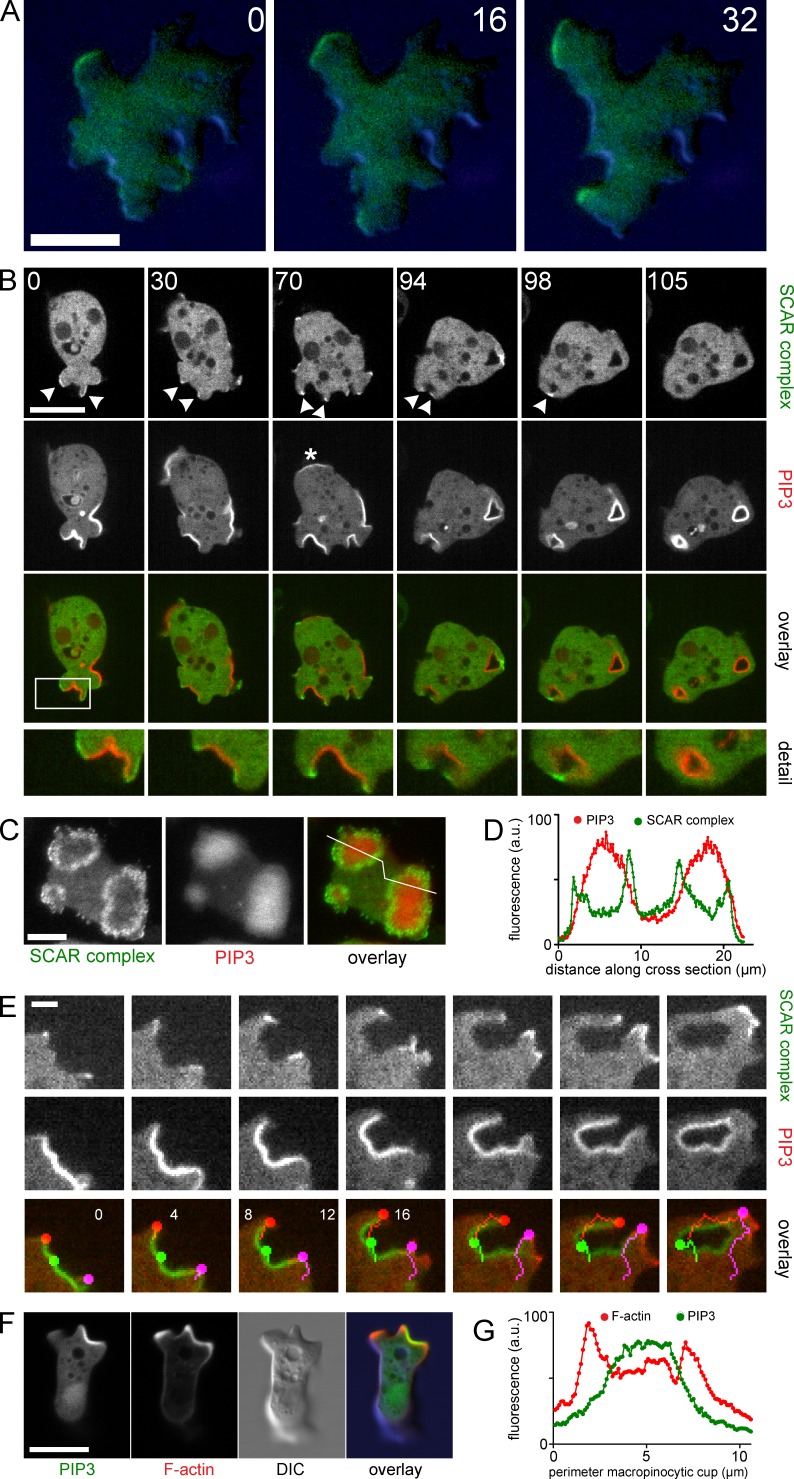
Figure 4.
SCAR, actin, and PIP3 in pseudopods and macropinosomes. (A) TIRF and DIC image of HSPC300-GFP during progression of a normal pseudopod of axenic AX3 cells. Cells were overlayed with 0.4% agarose to ensure contact with the glass surface. (B) Confocal series of an axenically grown AX2 cell expressing PH-CRAC-RFP and the SCAR complex marker HSPC300-GFP. Arrowheads show regions marked by HSPC300-GFP. Asterisk indicates a PIP3 patch that does not form a macropinosome. The boxed regions are shown in detail (2.2× magnification) in the bottom row. This corresponds with Video 2. (C) TIRF image of an axenically cultivated AX2 cell expressing PH-CRAC-RFP and HSPC300-GFP. (D) Profile plot of the line indicated in C. (E) Confocal image series of an axenic AX2 cell expressing PH-CRAC-RFP and HSPC300-GFP during macropinocytosis. Colored dots indicate the edges (red, purple) and center (green) of the PIP3 patch. (F) Confocal image of an axenic AX2 cell expressing Lifeact-mRFP and PH-CRAC-GFP with a pseudopod (top left) and a macropinosome (top right). (G) Profile plot of a line drawn along the perimeter of the developing macropinosome in F. All indicated times are in seconds. Bars: (A, B, C, and F) 10 µm; (E) 2 µm.

