Figure 2.
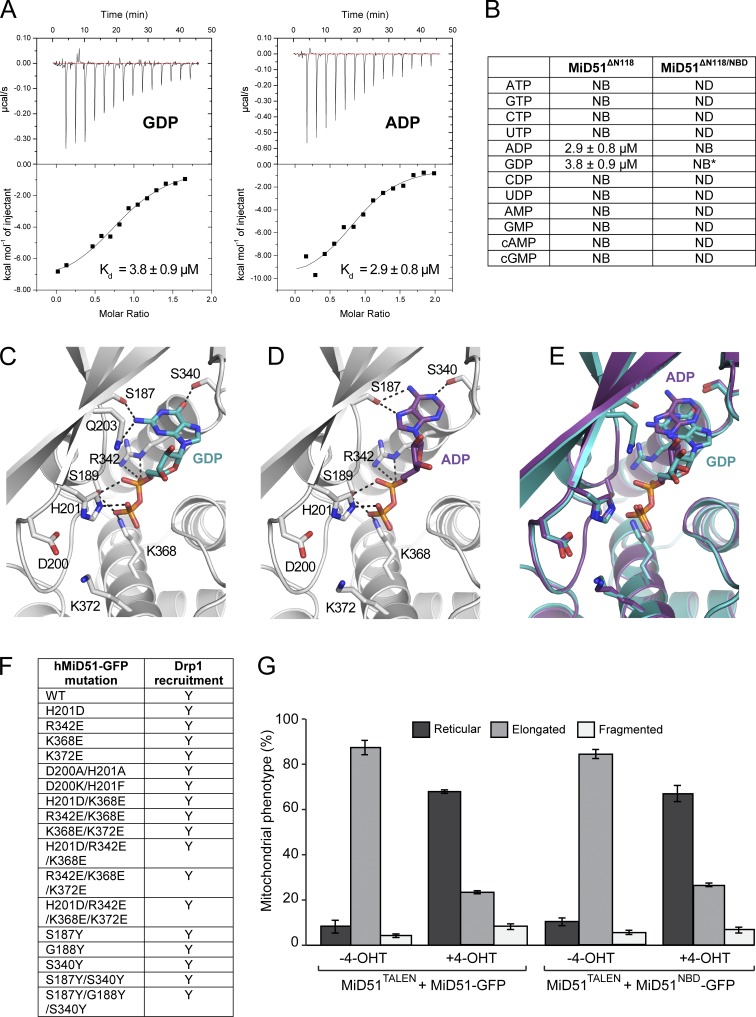
Analysis of MiD51 binding to GDP and ADP. (A) Raw heats of binding obtained using ITC by titration of MiD51ΔN118 with nucleotide. (B) Table of binding constants obtained by fitting ITC data to a single-state binding model. NB denotes no binding. Asterisk denotes n = 2. (C) Nucleotide binding pocket of MiD51 harboring GDP. Key MiD51ΔN118 residues are shown as sticks and GDP is shown in cyan. Hydrogen bonds are indicated by black dotted lines. (D) Nucleotide binding pocket of MiD51 harboring ADP. Key MiD51ΔN118 residues are shown as sticks and ADP is shown in magenta. Hydrogen bonds are indicated by black dotted lines. (E) Superposition of GDP-MiD51 (cyan) and ADP-MiD51 (magenta). (F) Summary of MiD51 mutants evaluated in immunofluorescence assays for Drp1 recruitment. (G) MiD51TALEN MEFs were induced to express MiD51-GFP or MiD51NBD-GFP with 4-OHT and mitochondrial morphology counted. Only MEFs with low-level GFP fluorescence were scored. n = 3; mean ± SEM; 100 cells counted/condition.

