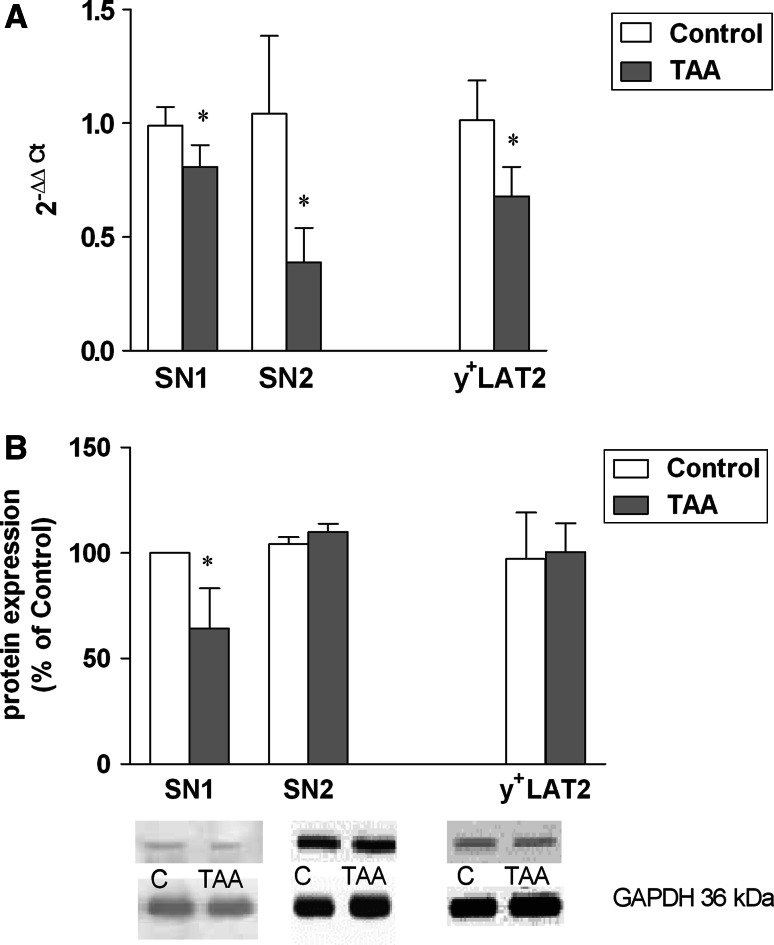
Fig. 2.
a, b Expression of SN1, SN2 and y+LAT2 at the mRNA (a) and protein (b) level in cerebral cortex of control rats and rats with TAA-induced HE. a Relative quantification of SN1, SN2, y+LAT2 mRNA. Total RNA was isolated using TRI Reagent (Sigma-Aldrich), and reverse-transcribed using High Capacity cDNA Reverse Transcribed Kit (Life Technologies; Applied Biosystems). Probes for SN1, SN2, y+LAT2 and β-actin (Rn 01447660, Rn 00684896, Rn 01431908_m1 and Rn 00667869, respectively) were purchased from Applied Biosystems. Further details were as described in Ref. [27]. Values in each group are mean ± SD for n = 8; *p < 0.05; T test. b Quantification of SN1, SN2, y+LAT2 protein densities. The antibodies used included SN1 (Santa Cruz Biotechnology; goat polyclonal, 1:500), SN2 (Santa Cruz Biotechnology; goat polyclonal, 1:1,000), y+LAT2 (Santa Cruz Biotechnology; 1:1,000, rabbit polyclonal) and GAPDH (Sigma-Aldrich; rabbit polyclonal, 1:3,000). Representative immunoblots of SN1, SN2, y+LAT2 and GAPDH (loading control) corresponding to the immunoblots of transporters. See Ref. [27] for further experimental details. Values in each group are mean ± SD for n = 5–8. (*p < 0.05; T test)

