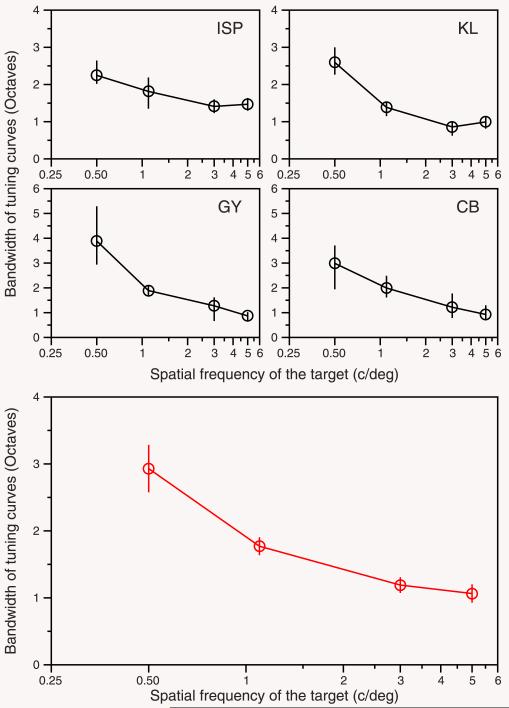
Figure 4.
Bandwidths of surround-suppression tuning curves. The four upper panels show the results for each subject. Black circles, data taken from the Boct values in Figure 2. Error bars show the 70% confidence interval estimated by bootstrap resampling. We generate 2000 thresholds (in the parallel condition) using a normal random distribution with the mean and SD of the thresholds in the Figure 2. We fitted Equation 1 (as in Figure 2) to the resampled data and then we took the percentiles 85% and 15% from the distribution of estimated bandwidths (Boct). The lower panel (red circles) shows the mean (± SEM) of bandwidths (in octaves) estimated from the four subjects.

