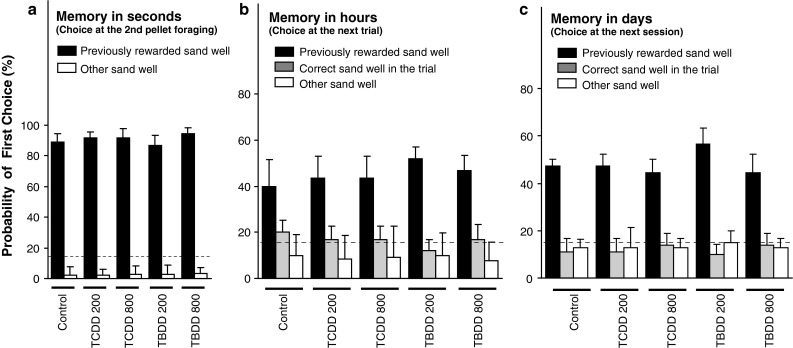
Fig. 4.

Simple memory formation. Between-group difference in simple memory performance was assessed with the following three indices of simple memory: a “memory in seconds”, b “memory in hours”, and c “memory in days”. Black bars correspond to the indices that represent the probability to choose the previously rewarded sand well as the first choice (but see “Materials and methods” for each detailed definition). Gray bars indicate the probability to choose the correct sand well in the session which was different from the previously rewarded one. White bars indicate the probability to choose other sand wells as the first choice. Dotted line indicates a chance level (16.7 %)
