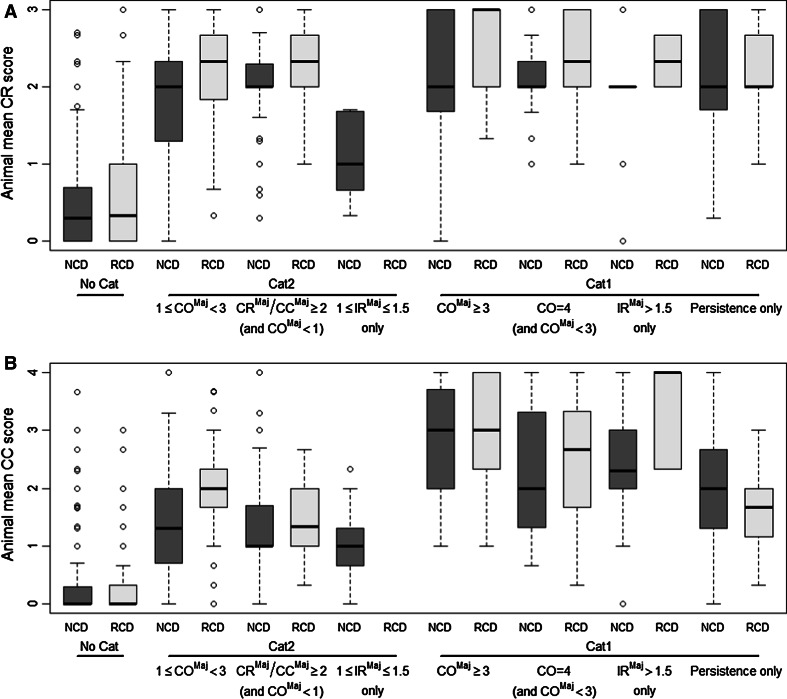
Fig. 2.
Boxplots presenting the distribution of individual animal mean CR (a) and mean CC (b) scores calculated over the reading times at 24, 48, and 72 h by classification driver. NCD: European New Chemicals Database, RCD: Reference Chemicals Databases, No Cat: not classified, Cat 2—1 ≤ COMaj < 3: classified based on majority of mean CO scores equal to or greater than 1 but less than 3, Cat 2—CRMaj/CCMaj ≥ 2 (and COMaj < 1): classified based on majority of mean CR and/or CC scores equal to or greater than 2 but with majority of mean CO scores less than 1, Cat 2—1 ≤ IRMaj ≤ 1.5 only: classified based on majority of mean IR scores equal to or greater than 1 but less than or equal to 1.5, Cat 1—COMaj ≥ 3: classified based on majority of mean CO scores equal to or greater than 3, Cat 1—CO = 4 (and COMaj < 3): classified based on CO = 4 but with majority of mean CO scores less than 3, Cat 1—IRMaj > 1.5 only: classified based on majority of mean IR scores greater than 1.5, Cat 1—Persistence only: classified based on persistence only. The whiskers correspond with the smallest and largest observation that fall within a distance of 1.5 times the length of the box (Interquartile Range, IQR) from the lower (bottom side of the box) and upper quartile (upper side of the box), respectively

