
Table 9.
Within-test variability of the mean CC scores calculated over the reading times at 24, 48, and 72 h. Proportion of animals within each CCMaj group
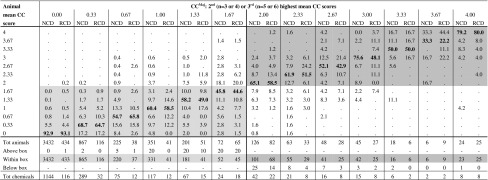
Proportions that fall in the light-grey area (No Cat range) correspond to animals with mean CC < 2 that were tested with chemicals with CCMaj < 2; Proportions that fall in the grey area (Cat 2 range) correspond to animals with mean CC ≥ 2 that were tested with chemicals with CCMaj ≥ 2; Proportions in bold (diagonal) correspond to animals with mean CC scores equal to the CCMaj of the chemicals tested in those animals
CC conjunctiva chemosis, NCD European New Chemicals Database, RCD Reference Chemicals Databases