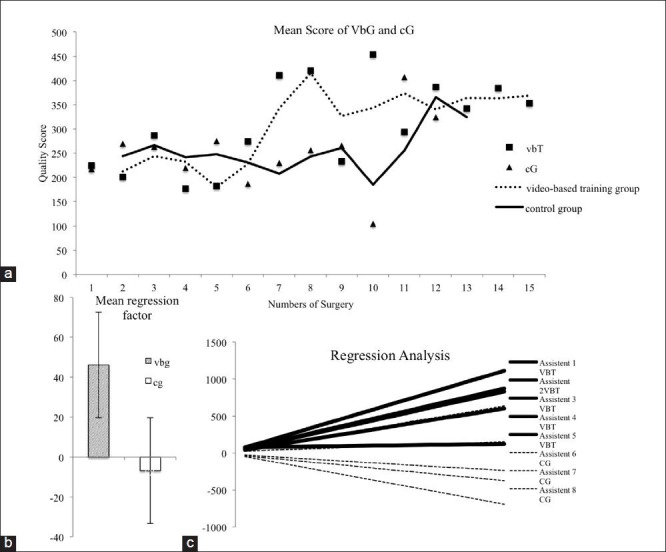
Figure 3.

(a) The learning curve of the video-based training group (VbG) and the control group (cG). The values shown were the mean quality score of all members in one surgical intervention of one group. The learning curve of the video-based group revealed a faster increase of the surgical skills after the sixth surgery and an earlier entry of the learning plateau. (b) The diagram presents the different mean gradients of the regression analysis. The video-based training group presents a significantly (P= 0.02) steeper gradient of their learning success between the beginning point and the seventh surgical interventions. (c) All linear regression curves are shown
