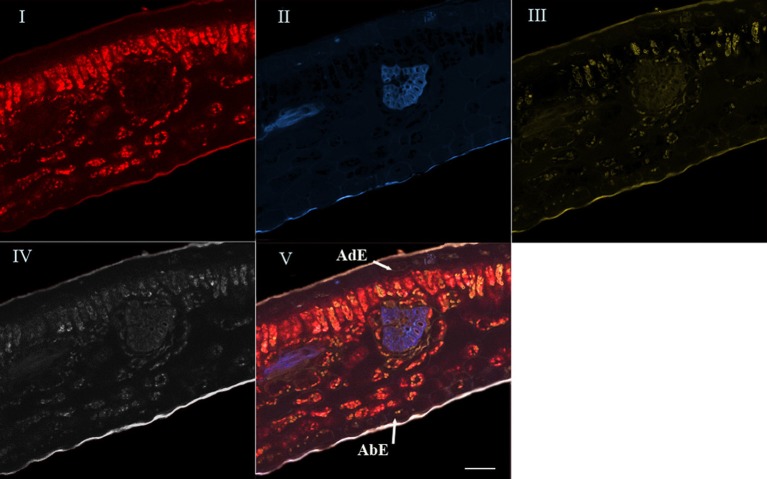
Figure 4.
Spectral analysis by linear unmixing method using chlorophyll, 5-CQA and mangiferin spectra. Merged image V was splitted into four base images (I, II, III, and IV). Base image I showed histolocalization of chlorophyll, whereas base images (II) and (III) represented histolocalization of 5-CQA and mangiferin, respectively. Finally, base image (IV) depicted other fluorescent compounds (residual fluorescence). AdE, adaxial epidermis; AbE, abaxial epidermis; Scale bar = 50 μm.

