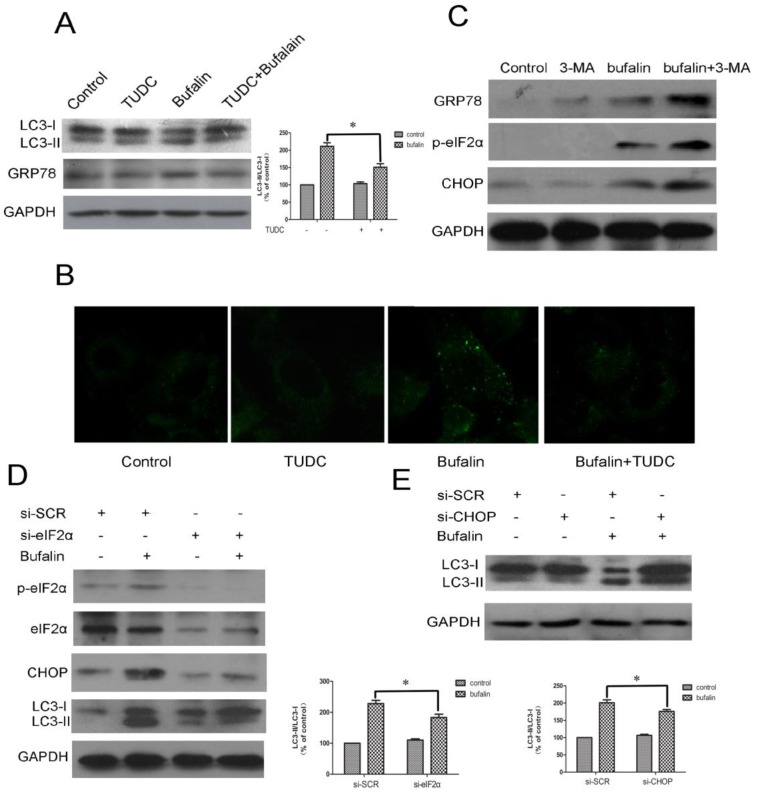
Figure 6.
Bufalin induces autophagy through stimulation of ER stress in U87MG cells. A-C: U87MG cells were pretreated or not with 500 μM TUDC (A-B) or with 3 mM 3-MA (C) for 1 h and further treated with 40 nM bufalin for 24 h. A: Western blot analysis for the expression of LC3 and GRP78. Relative levels of LC3-II to LC3-I ratio are indicated in the graphs. Data were quantified using ImageJ software (mean±SD, n =3). *p<0.05 versus the bufalin treatment alone. B: The number of MDC-labeled vacuoles was observed using a laser scanning confocal microscope (63X). C: Western blot analysis for the expression of p-eIF2α, GRP78 and CHOP. D-E: U87 cells transfected with sieIF2α/ siCHOP or sicontrol were treated with bufalin (40 nM) for 24 h and then harvested for protein analysis. Relative levels of LC3-II to LC3-I ratio are indicated in the graphs. Data were quantified using ImageJ software (mean±SD, n =3). *p<0.05 versus the bufalin treatment alone.

