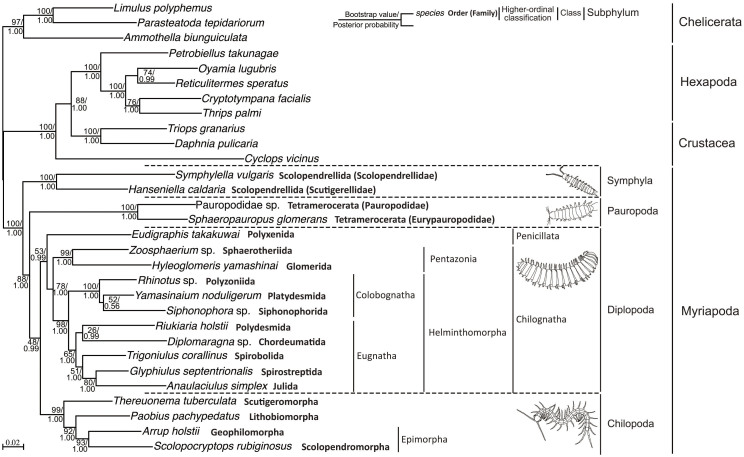
Figure 3. ML tree of Myriapoda based on the combined amino acid sequences of DPD1, RPB1, and RPB2.
ML bootstrap values (top) and Bayesian posterior probability (bottom) are shown at each node. Bold letters after the species name indicate order name. Higher taxon names of Myriapoda are indicated to the right of the tree. The illustrations of the four representative myriapods were drawn by the first author (H.M.) based on the pictures shown in Fig. 1.

