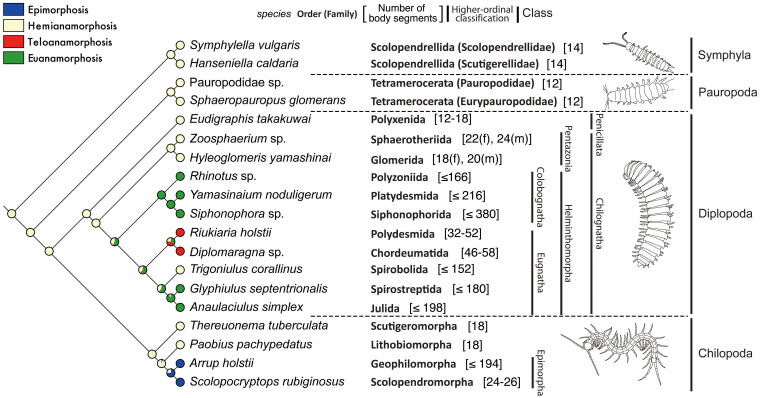
Figure 5. Evolutionary transition of post-embryonic development mode.
Ancestral state estimation is based on the RAxML topology (Fig. 3) using a likelihood algorithm. Pie charts represent the relative likelihood of different mode of post-embryonic development. The number of body segments of the myriapods belonging to the order is shown in brackets after the order name. The illustrations of the four representative myriapods were drawn by the first author (H.M.) based on the pictures shown in Fig. 1.

