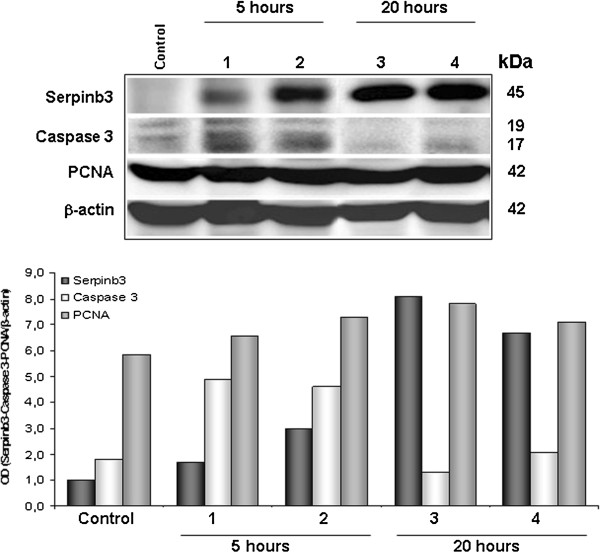
Figure 3.
Western blot analysis. Upper Panel) Representative images of Western blot analysis for Serpinb3, activated Caspase 3 and PCNA in liver homogenates of two mice sacrificed at 5 hours (lanes 1,2) and of two mice sacrificed at 20 hours (lanes 3,4) after treatment with LPS/D-galactosamine. The liver of a control mouse has also been shown. Lower Panel) Densitometric analysis of the above results expressed as optical density (OD) of each molecule. The quantitative densitometric values are normalized to β-actin.

