. 2014 Jan-Mar;56(1):61–66. doi: 10.4103/0019-5545.124715
Copyright: © Indian Journal of Psychiatry
This is an open-access article distributed under the terms of the Creative Commons Attribution-Noncommercial-Share Alike 3.0 Unported, which permits unrestricted use, distribution, and reproduction in any medium, provided the original work is properly cited.
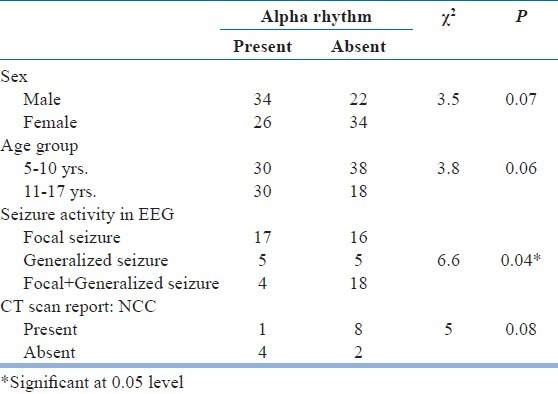
Table 8.
Alpha distribution pattern compared in study group

