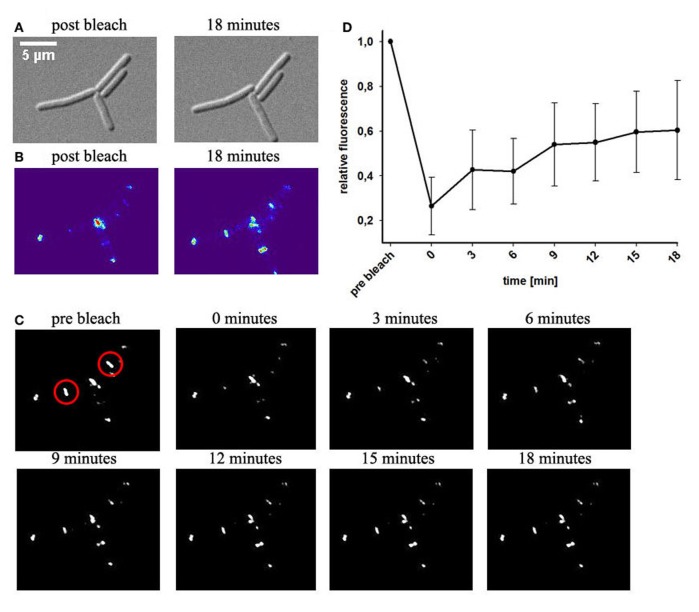
Figure 2.
Fluorescence recovery after photobleaching of DivIVA-GFP. Cells expressing DivIVA-GFP under control of the native promoter were grown on agarose slides supplemented with LB. (A) DIC images of B. subtilis cells expressing DivIVA-GFP directly after a bleaching event and after 18 min are shown (B) Heat maps of the GFP signal and time lapse images indicate fluorescence distribution (C). DivIVA-GFP was bleached (red circles) as described in material and methods. Pictures were taken every 3 min after the bleaching event. Images show GFP fluorescence. (D) Quantification of the recovery rate of bleached spots; n = 6.

