Figure 3.
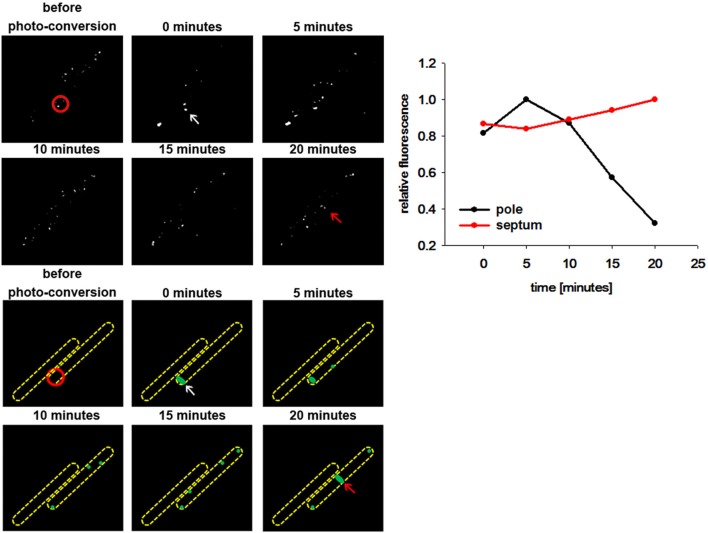
DivIVA-PA-GFP is dynamically recruited from the cell pole to the septa. DivIVA-PA-GFP fluorescence was imaged before photo-activation using DIC and FITC specific filters. Photoactivation was performed using a laser at 405 nm (red circle). After photoactivation DivIVA-PA-GFP (white arrow) is localized at the cell pole. Although, the signal gets more diffuse over time, accumulation at a new septum after 20 min becomes evident (red arrow). A cartoon of DivIVA-PA-GFP dynamics is drawn below. The relative fluorescence of the pole (white arrow) and the new formed septa (red arrow) was measured. The relative fluorescence of the according spots were calculated (CTF was calculated and the highest CTF of all spots were set as 1) and plotted. For every time point spots were chosen individually.

