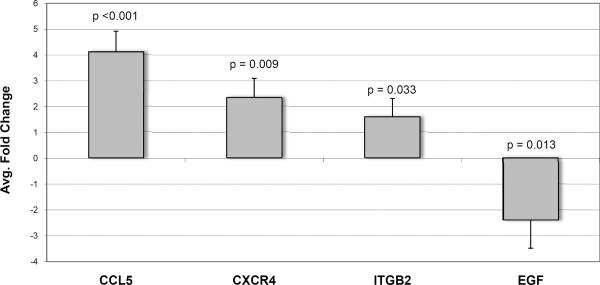
Figure 3. Validation of microarray results.
Real-time quantitative PCR results of genes selected for confirmation from the microarray results. CCL5, CXCR4 and ITGB2 were up-regulated while EGF was down-regulated in GFR-low samples. GAPDH was used as the normalizing internal control. Statistical significance was tested using a paired t-test comparing GFR-high (control) samples to GFR-low samples.

