
Figure 7.
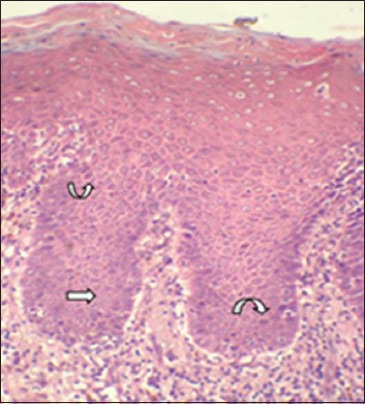
Photomicrograph showing basilar hyperplasia (straight arrow) and hyperchromtic nuclei in group3 (curved arrow). (H&E stain, ×200)
Official websites use .gov
A
.gov website belongs to an official
government organization in the United States.
Secure .gov websites use HTTPS
A lock (
) or https:// means you've safely
connected to the .gov website. Share sensitive
information only on official, secure websites.
Photomicrograph showing basilar hyperplasia (straight arrow) and hyperchromtic nuclei in group3 (curved arrow). (H&E stain, ×200)