
Figure 8.
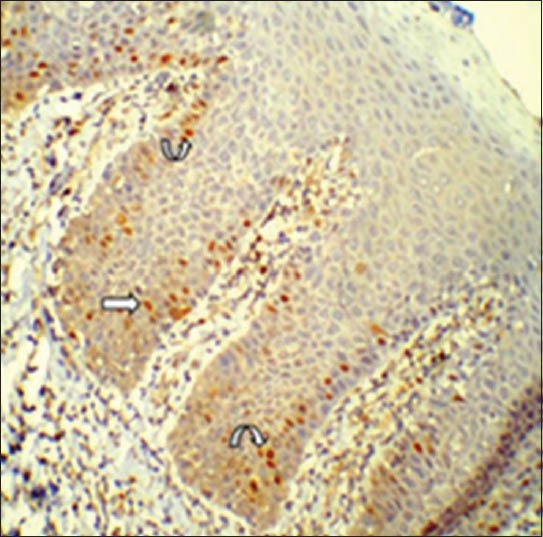
The corresponding image showing cyclin D1 immunohistochemical expression in sections with basilar hyperplasia (straight arrow) and hyperchromatic nuclei in group 3 (curved arrow). (IHC stain, ×200)
Official websites use .gov
A
.gov website belongs to an official
government organization in the United States.
Secure .gov websites use HTTPS
A lock (
) or https:// means you've safely
connected to the .gov website. Share sensitive
information only on official, secure websites.
The corresponding image showing cyclin D1 immunohistochemical expression in sections with basilar hyperplasia (straight arrow) and hyperchromatic nuclei in group 3 (curved arrow). (IHC stain, ×200)