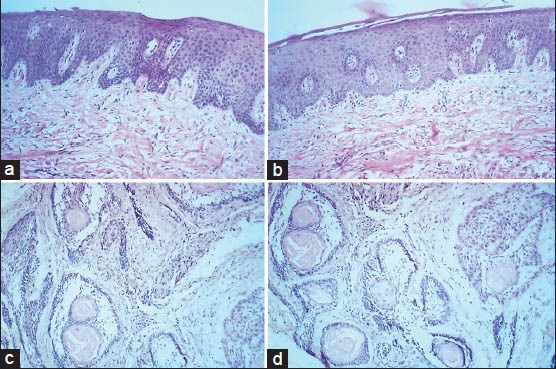
Figure 1.

Comparison of photomicrographs of sections stained with routine H and E staining in (a) epithelium and connective tissue and (c) Ameloblastoma (×100), with xylene free H and E staining in (b) epithelium and connective tissue and (d) Ameloblastoma (×100)
