Figure 10.

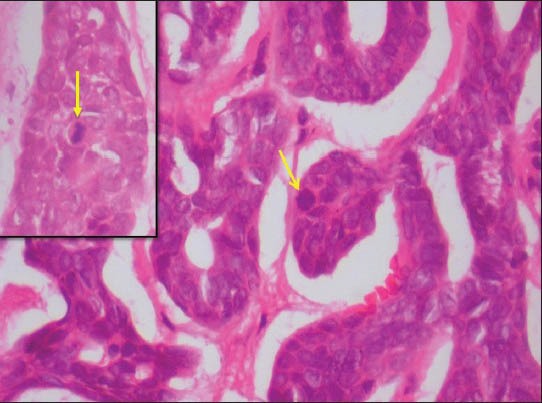
Atypical mitotic figure (arrow) seen in the tumor island (H&E stain ×400). Inset – typical mitotic figure (arrow) seen in the tumor island (H&E stain, ×400)

Atypical mitotic figure (arrow) seen in the tumor island (H&E stain ×400). Inset – typical mitotic figure (arrow) seen in the tumor island (H&E stain, ×400)