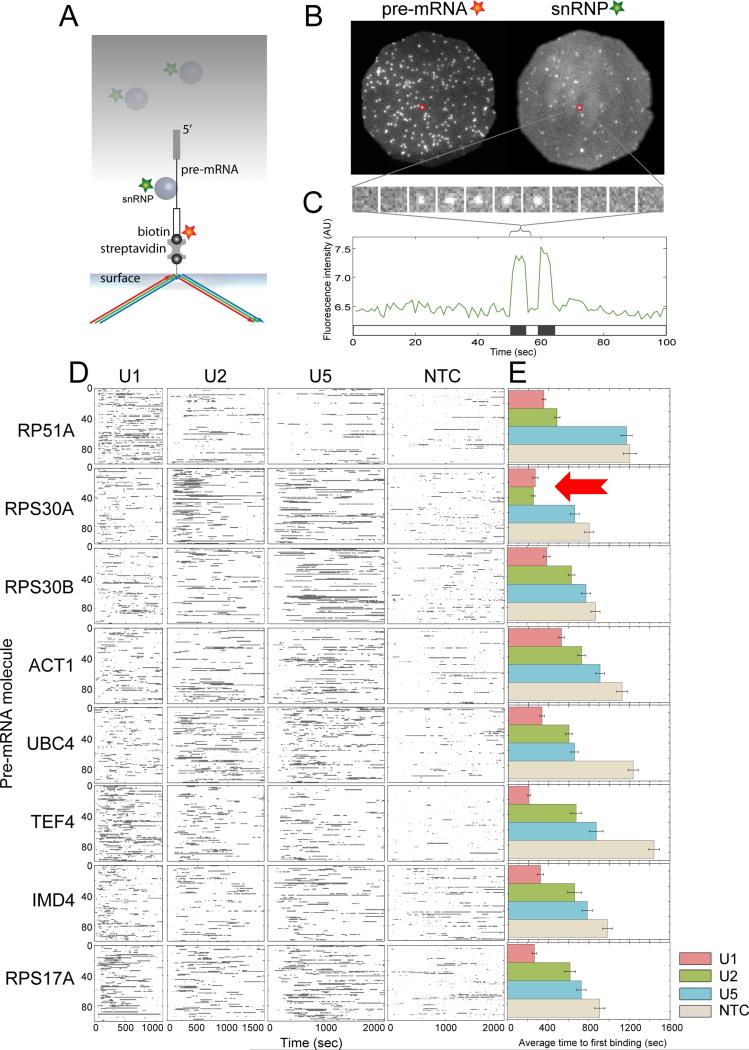
Figure 2.
Recruitment of individual spliceosomalsubcomplexes to single surface-tethered pre-mRNA molecules observed by CoSMoS.(A)Experimental design.Spliceosomalsubcomplexes (circles) labeled with a green dye (star) colocalized with surface-tethered pre-mRNA moleculeslabeled with a red dye (star) were visualized by total internal reflection fluorescence (TIRF) microscopy using excitation with red and green lasers (arrows). Subcomplexes free in bulk solution (gray shading) were not detected. (B) Example CoSMoS data showing binding of U1 snRNP to ACT1 premRNA. Fluorescence emission from a single field of view (diameter 24 μm) was separated to produce images of pre-mRNA and U1 snRNP molecules. Individual molecules are detected as discrete spots of fluorescence; red squares mark an example of a pre-mRNA molecule with U1 bound. (C) Top: part of the time series of U1 fluorescence images taken from the location of the pre-mRNA molecule marked in (B) (1 sec per frame). Bottom: Complete time record of U1 fluorescence from the same premRNA. Intervals in which U1 is colocalized with the pre-mRNA are indicated as black bands on the time ribbon. (D)Rastergrams (stacked time ribbonsfor multiple individual pre-mRNA molecules) summarizing the recruitment of the U1, U2, U5 and NTC by eight different pre-mRNAs. Each rastergram shows data on 100 pre-mRNA molecules taken from a separate experiment (32 experiments total). Only the first 1100, 1600, 2000, and 2000 sec of data are shown for U1, U2, U5 and NTC, respectively. (E). Average time (±S.E.M.) to first binding of the indicated subcomplex to each pre-mRNA molecule. See also Figure S1.

