
Figure 3. The ROCs for photoplethysmographic versus polysomnographic AHI estimates.
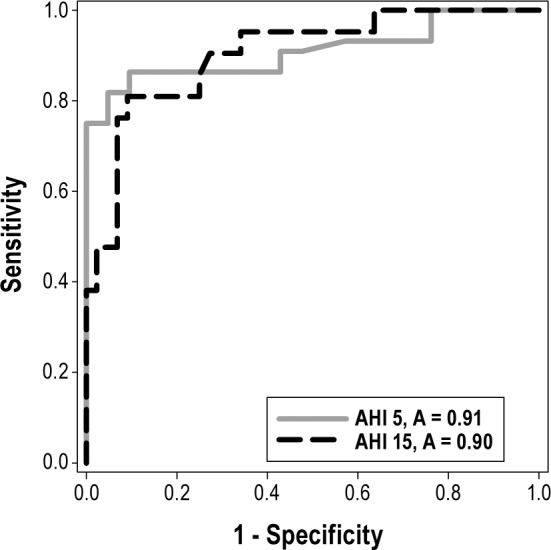
Two curves are shown with the AHI diagnostic threshold set at 5 and 15 events/h. A, area.
Official websites use .gov
A
.gov website belongs to an official
government organization in the United States.
Secure .gov websites use HTTPS
A lock (
) or https:// means you've safely
connected to the .gov website. Share sensitive
information only on official, secure websites.
Two curves are shown with the AHI diagnostic threshold set at 5 and 15 events/h. A, area.