Figure 1.

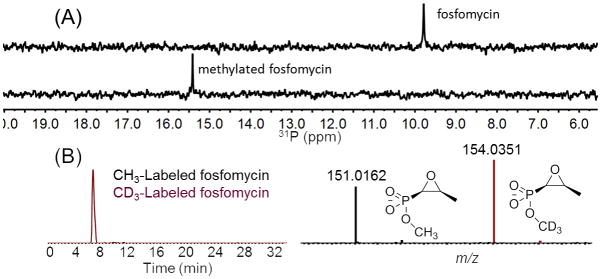
(A) 31P NMR spectrum of fosfomycin (top) and after treatment with DhpI and a mixture of SAM and d3-SAM (1:1) (bottom). (B) LC-MS analysis of the sample in the bottom spectrum of panel A.

(A) 31P NMR spectrum of fosfomycin (top) and after treatment with DhpI and a mixture of SAM and d3-SAM (1:1) (bottom). (B) LC-MS analysis of the sample in the bottom spectrum of panel A.