
Figure 1.
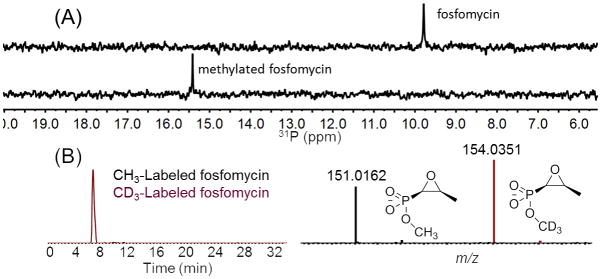
(A) 31P NMR spectrum of fosfomycin (top) and after treatment with DhpI and a mixture of SAM and d3-SAM (1:1) (bottom). (B) LC-MS analysis of the sample in the bottom spectrum of panel A.
Official websites use .gov
A
.gov website belongs to an official
government organization in the United States.
Secure .gov websites use HTTPS
A lock (
) or https:// means you've safely
connected to the .gov website. Share sensitive
information only on official, secure websites.
(A) 31P NMR spectrum of fosfomycin (top) and after treatment with DhpI and a mixture of SAM and d3-SAM (1:1) (bottom). (B) LC-MS analysis of the sample in the bottom spectrum of panel A.