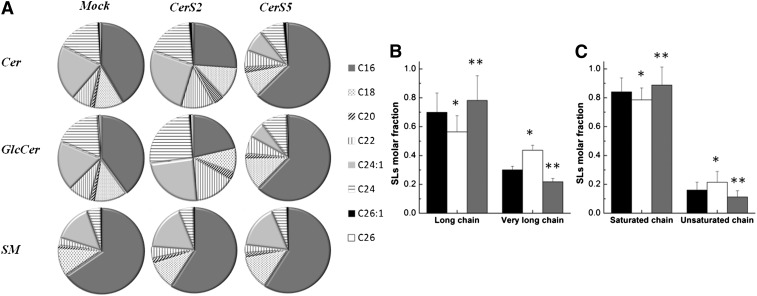
Fig. 1.
The distribution of N-acyl chain SLs in HEK cells. A: ESI-MS/MS was used to determine the percent distribution of acyl chains in Cer, SM, and glucosylceramide in mock-, CerS2-, and CerS5-transfected HEK cells. B: Molar fraction of LC-SLs (C16–C20) and VLC-SLs (C22–C26). C: Molar fraction of saturated and unsaturated SL species. Data for mock-, CerS2-, and CerS5-transfected cells are shown in black, white, and gray, respectively. The values are the average (±SD) of n ≥ 3; *P < 0.05; **P < 0.01.

