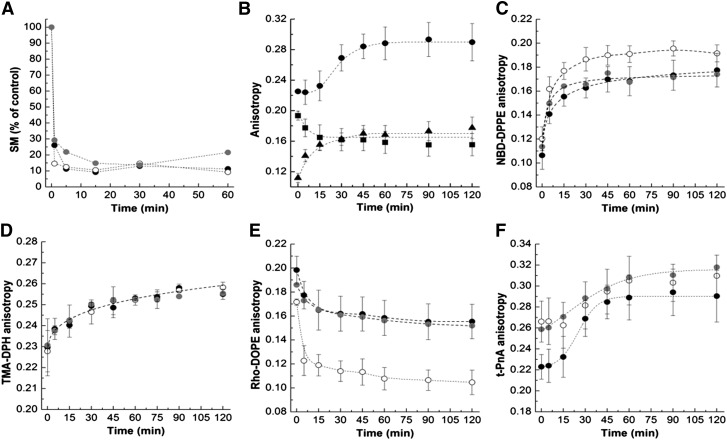
Fig. 4.
Impact of bSMase-generated Cer in HEK cells overexpressing CerS2 or CerS5. A: SM hydrolysis in mock- (black circles),CerS2 (open circles)-, and CerS5-transfected (gray circles) HEK cells upon treatment with 0.5 U/ml of bSMase. B: Fluorescence anisotropy of t-PnA (•), Rho-DOPE (■), and NBD-DPPE (▲) was measured in mock-transfected cells to evaluate the time-dependent alterations undergone on the membrane upon treatment with 0.5 U/ml of bSMase. The fluorescence anisotropy of NBD-DPPE (C), TMA-DPH (D), Rho-DOPE (E), and t-PnA (F) was measured over time in cells treated with 0.5 U/ml of bSMase. The symbols are the same as in (A). The values are the average (±SD) of n ≥ 3; all measurements were performed at 37°C.

