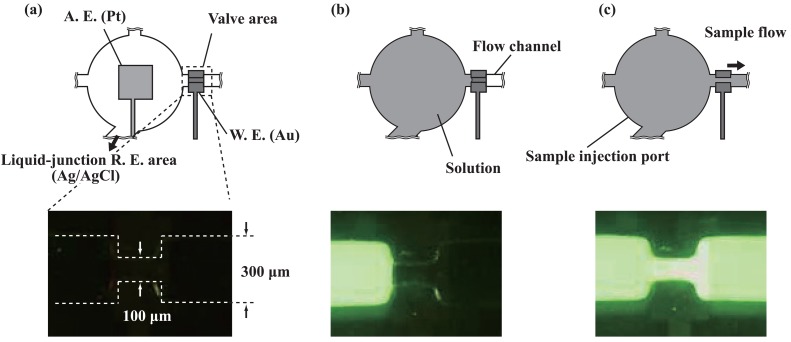
Figure 2.
Switching of the valves at the sample injection port. The upper figures show the area including one of the valves and the injection port. The lower figures show the movement of a fluorescein solution through the valve. (a) Before injecting a solution. (b) A solution is filled in the sample injection port. (c) The solution passes the valve area when the potential is applied to the valve working electrode. W. E., working electrode; R. E., reference electrode; A. E., auxiliary electrode.

