
Figure 1.
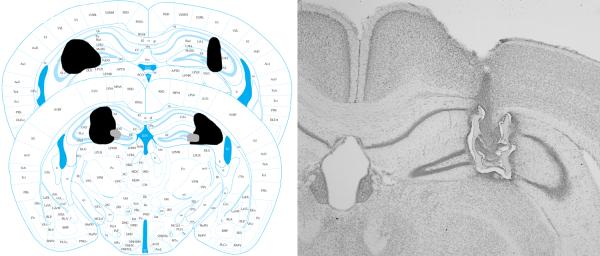
Left: Reconstructions of the largest (black) and smallest (grey) lesions that were included in the data analysis for Experiment 5. Figures from Franklin and Paxinos (2008) used with permission. Right: Photomicrograph of a representative lesion.