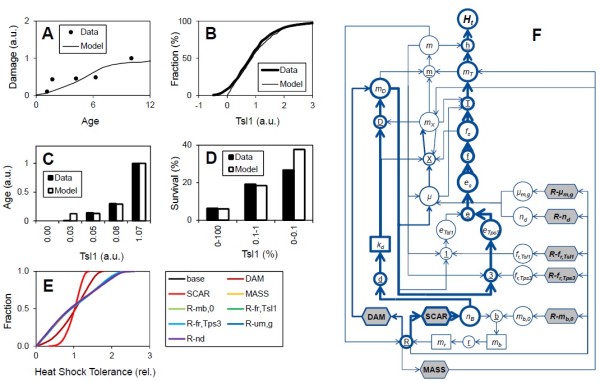
Figure 2.

Model-data comparison and heterogeneity source and pathway analysis. (A) Damage (mD/m) vs. age (nB). Data from [33]. (B) Tsl1 expression (eTsl1) distribution of cells. (C) Age (nB) vs. Tsl1 expression (eTsl1). (D) Heat shock survival of various Tsl1-sorted fractions. Data from [15]. “a.u.” is arbitrary units. (E) Distribution of heat shock tolerance for base case and various diagnostic simulations (e.g. “dam” has equal damage partitioning, sd = 0.5). (F) Heterogeneity network. Line weight indicates contribution of node or link to overall heterogeneity in heat shock tolerance (based on variance of normalized Ht, e.g., panel E). For details of experiments used to generate the data the reader is referred to the source publications.
