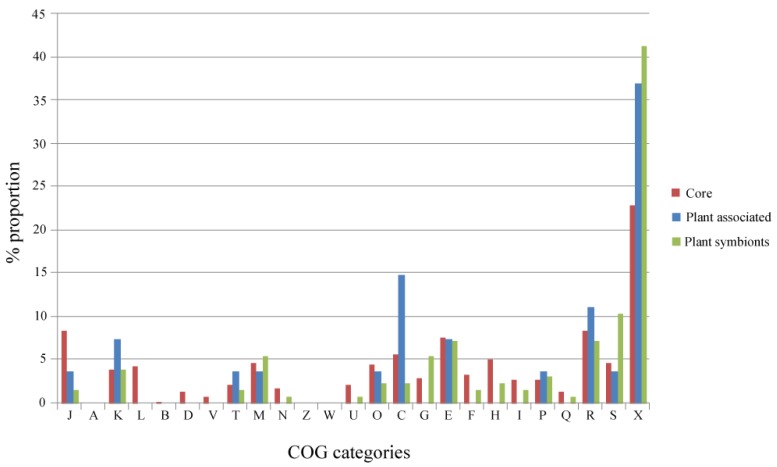
Figure 3.
Percent distribution of orthologous groups belonging to the different subsets (Core, Plant-Associated and Plant symbionts) among Cluster of Orthologous Groups (COG) categories. Note that each orthologous group can be mapped to more than one category. The list of COG codes is reported in Supplementary Material S3.

