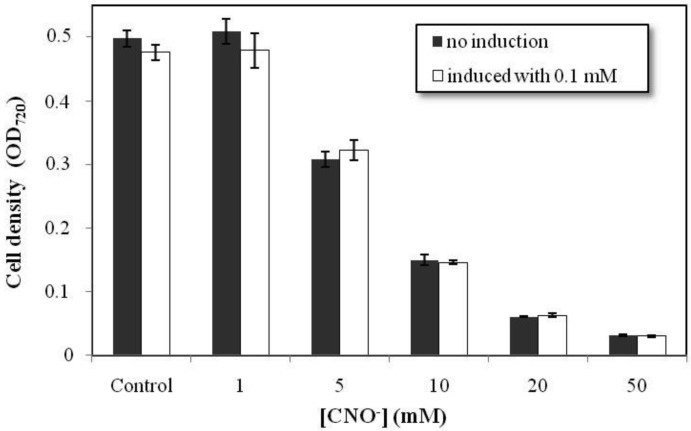
Figure 1.
Resistance of Chromobacterium violaceum to cyanate (CNO−). The resistance assays were conducted at five concentrations of cyanate (1, 5, 10, 20 and 50 mM), using two groups of cells, not induced and induced with 0.1 mM cyanate. The error bars indicate the standard deviations for the mean values derived from the analyses in triplicate. Data on the growth of the two groups was compared using ANOVA, with a p < 0.05 significance level.

