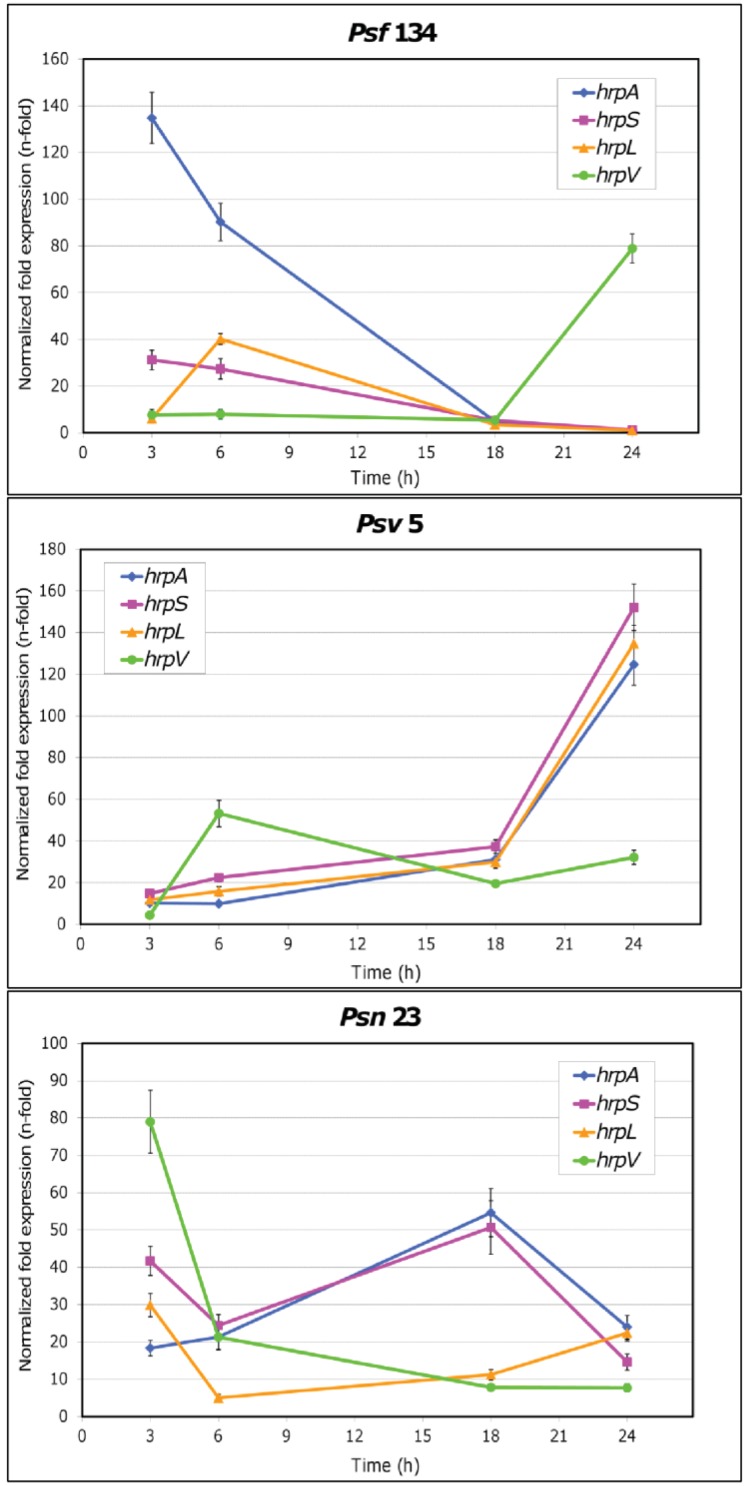
Figure 3.
Time course of hrpL, hrpA, hrpS and hrpV expression in P. savastanoi pv. fraxinii (Psf134), pv. savastanoi (Psv5) and pv. nerii (Psn23). Relative expression in minimal medium (MM) is reported, setting expression in King's B medium (KB) as reference [59]. The pathovar referred to each graph is reported as graph title. The color used for each gene is indicated in the label. The vertical lines indicate standard deviation values, and where they are absent, the limits were within the symbol dimensions. The numerical values for each point analyzed are reported in Table S3.

