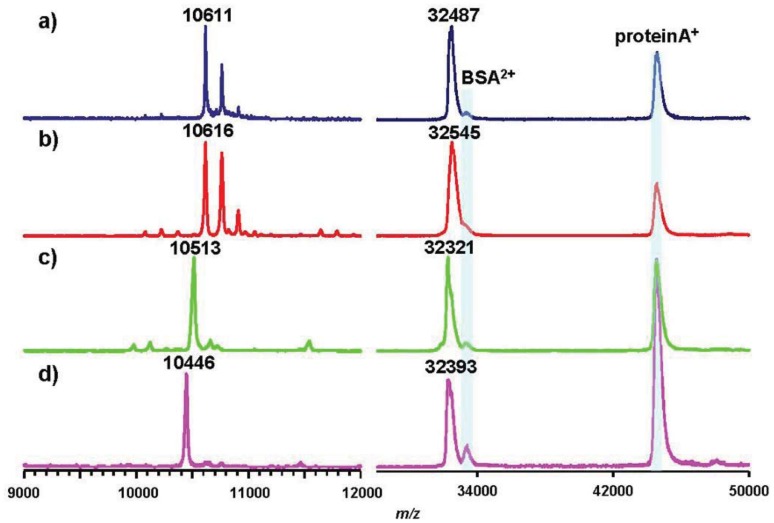
Figure 6.
Comparison of MALDI-TOF mass spectra among pathovars in P. syringae. Mass spectra on the left side are of trypsin-digested flagellin polypeptide (N136-R210) of pv. tabaci 6605 (a), pv. phaseolicola 1448A (b), pv. tomato DC3000 (c), and pv. syringae B728a (d). Those on the right side are of intact flagellins. Blue peaks are of the calibration standard mixture.

