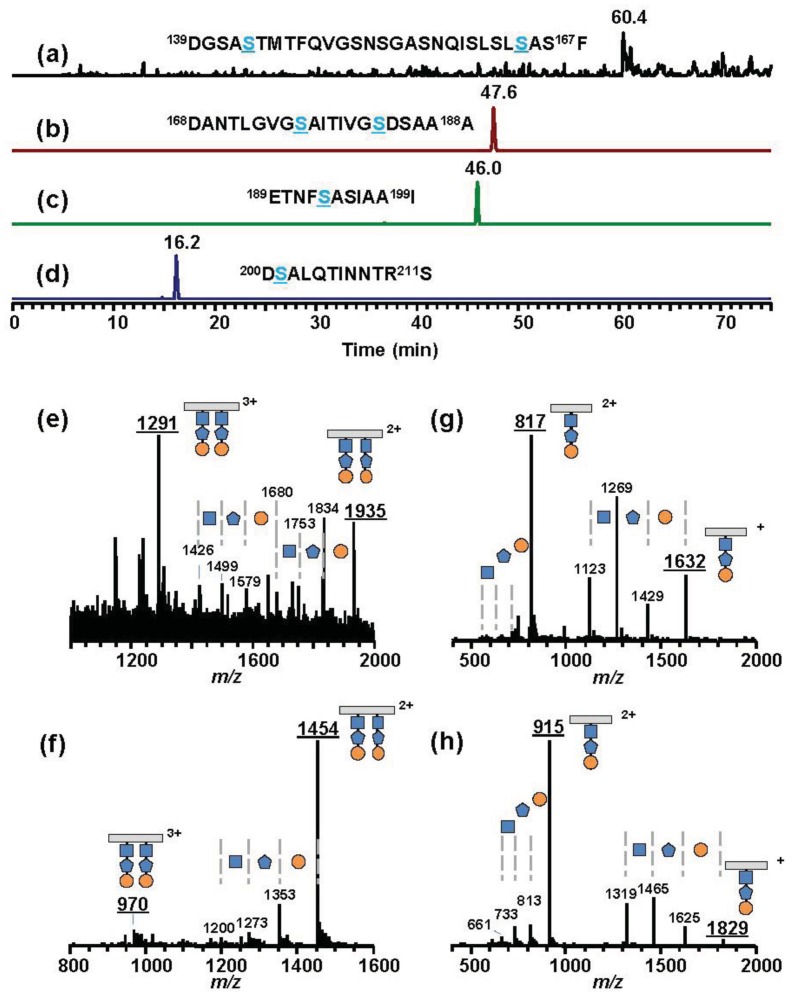
Figure 7.
Extracted ion chromatograms (XIC) and mass spectra of P. syringae pv. syringae B728a. Asp-N digested glycopeptides were analyzed by LC-ESI/MS. XICs are of calculated m/z values in Table 2 corresponding to four glycopeptides, D139-F167 (a), D168-A188 (b), E189-I199 (c), and D200-S211 (d). Blue Ser residues have glycans. The dominant peak at 60.4 min in XIC (a) gave the mass spectrum (e), which showed [M+2H]2+ at m/z 1,935 ([3,869 (monoisotopic mass of glycosylated D139-F167) + 2 (two protons)]/2 (double charge)) and [M+3H]3+ at m/z 1,291 ([3,869 (monoisotopic mass of glycosylated D139-F167) + 3 (triple protons)] / 3 (triple charge)). The peak at m/z 1,834 is the fragment ion losing the terminal saccharide (orange circle). Other peaks at m/z 1,753, 1,680, 1,579, 1,499, and 1,426 are the fragment ions of a cascade of deglycosylation. The peaks in the XICs (b–d) also gave the mass spectra showing [M+H]+, [M+2H]2+, or [M+3H]3+ (the m/z values are underlined) accompanied by deglycosylated fragment ions (f–h, respectively). All glycopeptides have glycans composed of saccharides with masses of 203 (N-acetylated hexosamine, orange circle), 160 (methylated deoxyhexose, blue pentagon), and 146 (deoxyhexose, blue square) from the distal end. The symbol “+” or “2+” means the ion singly charged or doubly charged, respectively.

