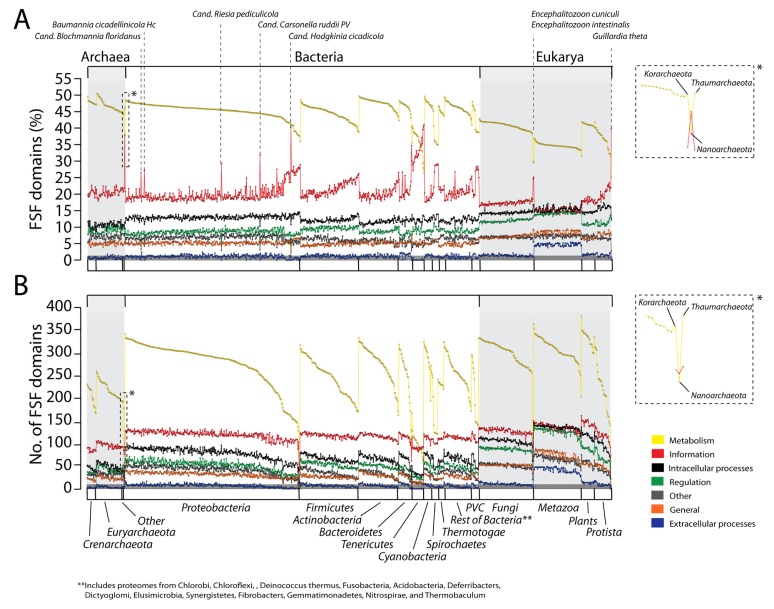
Figure 2.
The functional distribution of FSFs in individual proteomes of the three superkingdoms. Both the percentage (A) and actual FSF numbers (B) indicate conservation of functional distributions in proteomes and the existence of considerable functional flexibility between superkingdoms. Dotted vertical lines indicate genomic outliers. Insets highlight the interplay between Metabolism (yellow trend lines) and Information (red trend lines) in N. equitans.

