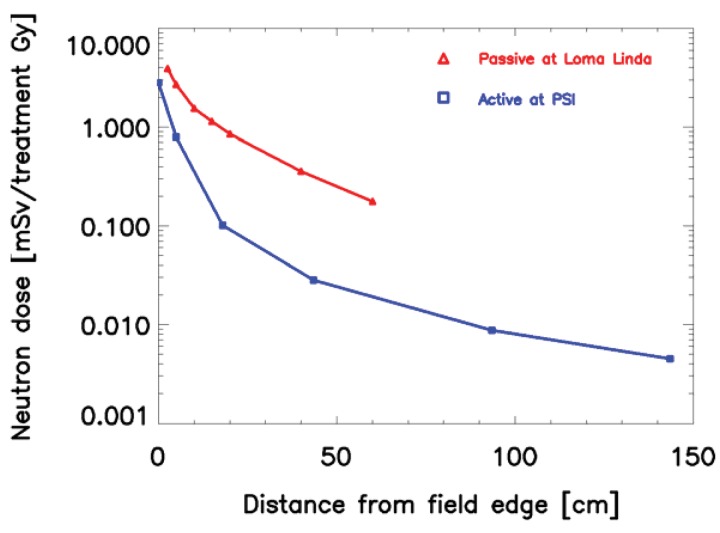
Figure 3.
Comparison of neutron dose equivalent given in mSv per treatment Gy for two proton therapy beam lines for a prostate treatment. The red curve shows the results of measurements at the passive (scatter) beam line at Loma Linda [29,30] and the blue curve results from measurements at the active beam line at Paul Scherrer Institute (PSI) [28]. All measurements were performed perpendicular to the beam direction.

