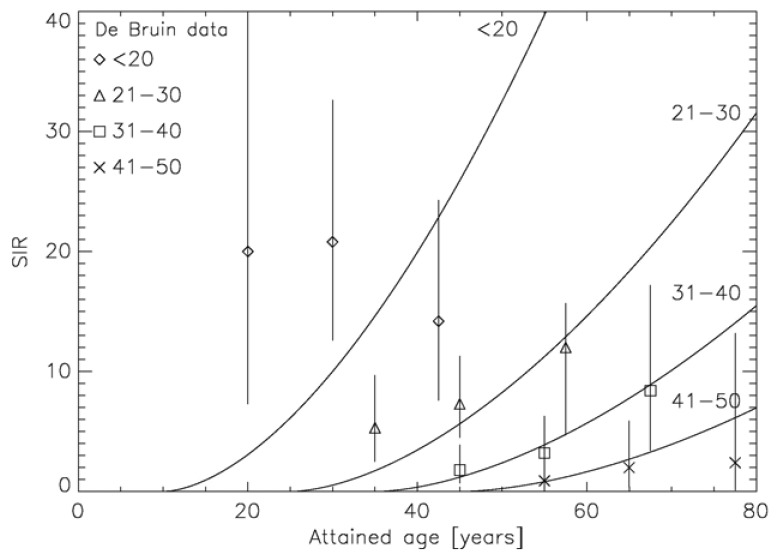
Figure 7.
Verification of the modeled time patterns with epidemiological data. Plot of the modeled age dependence of the standardized incidence ratio (SIR) as the solid lines for the age at treatment groups <20, 21–30, 31–40 and 41–50, respectively. The corresponding epidemiological data from de Bruin et al. [9] are plotted as the symbols together with the corresponding 95% confidence interval.

